Feedback Loop
A feedback loop is system structure that causes output from one node to eventually influence input to that same node.
 For example, the work output of a population can increase the goods
and services available to that population, which can increase
the average life expectancy, which can increase the population,
which can increase the work output still more, and the loop
starts all over again. Using system
dynamics notation, this feedback loop would look like
the Population Growth loop shown.
For example, the work output of a population can increase the goods
and services available to that population, which can increase
the average life expectancy, which can increase the population,
which can increase the work output still more, and the loop
starts all over again. Using system
dynamics notation, this feedback loop would look like
the Population Growth loop shown.
Why feedback loops are an important tool
While the above example may seem simple and obvious, that's because we drew a simple model with only one loop and 4 variables. Few real world problems are as simple. For example, The Dueling Loops of the Political Powerplace model has 43 variables, 3 main loops, about 5 additional loops, and 4 stocks. It is a simplification of a larger model that has 123 variables, 11 stocks, and countless loops. Its construction took a single person several years. Another example is the World3 model in Limits to Growth, which contains about 300 variables and 20 stocks. It took 17 researchers 2 years to construct the model.
Understanding the behavior of difficult complex social system problems well enough to even begin to hypothesize a realistic solution, with a high probability of working the first time, is impossible without understanding the feedback loops involved.
A quick introduction to how feedback loops work
The universe contains only two kinds of feedback loops: reinforcing and balancing, also called positive and negative feedback loops. Once you grasp how they work you are well on your way to understanding the foundation of systems thinking.
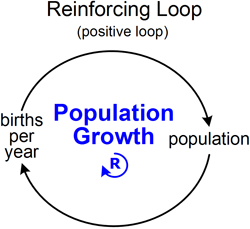 A feedback loop occurs when a change in something ultimately comes back to cause a further change in the same thing. If the further change is in the same direction it’s a positive or reinforcing loop. If it’s in the opposite direction it’s a negative or balancing loop, also called a goal-seeking loop.
An example of a reinforcing loop is Population Growth. As population goes up, so does births per year. As that goes up, so does future population. The loop goes round and round, growing exponentially until the loop hits its limits, which are not shown.
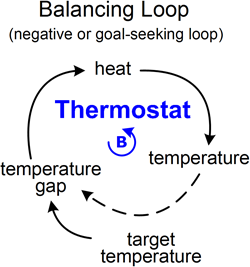 An example of a balancing loop is a Thermostat. In a balancing loop the gap equals the target minus the actual state. Suppose you set the target temperature to 65 degrees. The higher the target the greater the temperature gap. The greater the gap the more heat that flows into the system. That increases the temperature. As this goes up the temperature gap goes down. It keeps going down until the gap is zero, at which point the system has reached the target.
These are causal loop diagrams. They can't be simulated but are very useful for high level feedback loop simple modeling.
Arrows indicate that one node influences another. Solid arrows are a direct relationship. One node varies directly with another. If A goes up then so does B, or if A goes down then so does B. Dashed arrows are an inverse relationship. If A goes up then B goes down and vice versa. As simple as models like these are, they can allow problem solvers to understand the relevant behavior of complex systems well enough to solve surprisingly difficult problems.
The main challenge in social problem analysis is to figure out what the most important feedback loops driving a system’s behavior are and then what they should be. While large social systems contain millions of loops, the decisive behavior of any specific problem is controlled by only a few of these loops. These determine the basic structure of a system, which is the shape of the important loops defining the system’s behavior of interest. The First Law of Modeling states that if you don’t understand a system’s key feedback loops then you don’t understand the system. But once you do understand them you are a giant step closer to controlling the system’s behavior.
 Feedback loops control the behavior of a system over time, as shown by the graphs above. Reinforcing loops cause either runaway (1) exponential growth or (2) exponential decline. For example, the world’s population began growing exponentially when its limits were suddenly raised by the fruits of the Industrial Revolution and modern technology. Balancing loops cause (2) goal-seeking behavior. Iin a balancing loop a quantity such as temperature will grow rapidly for awhile and then slow down, as it homes in on its goal.
A balancing loop with a delay causes (4) oscillation around the goal of the loop. The loop is continually overshooting and undershooting the goal due to the information delay. It learns too late when it should correct its growth or decline. For example, most thermostats oscillate around their temperature goal by a few degrees.
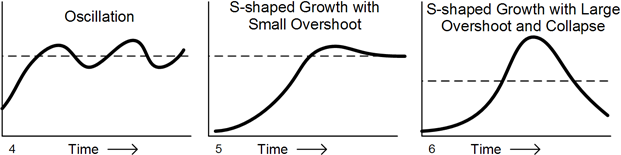
All realistic models have at least one reinforcing and one balancing loop. An exponential growth loop combined with a goal seeking loop and a small delay causes (5) S-shaped growth with small overshoot. As the delay for correction to the goal grows, the overshoot becomes so large that the perfect approach to the goal shown in graph 5 becomes impossible. The results is (6) S shapped growth with large overshoot and collapse. This is the plight of Homo sapiens today. Due to high systemic change resistance, solution delay has caused large overshoot. The larger the overshoot becomes the more likely a large collapse becomes.
NOTE - The above six graphs were reconstructed from nearly identical ones in John Sterman's Business Dynamics: Systems Thinking and Modeling for a Complex World, page 108. Sterman makes the important point that "The most fundamental modes of behavior are exponential growth, goal seeking, and oscillation." The additional three graphs are merely combinations or variations of the three fundamental modes.